Localization under different environments, part 2
This is a continuation of the previous post on localization under heterogenous features (see here), where we made clear that localization appears faster with more distinctive features present in an environment. The assumption of course is that the robot sensor is capable of distinguishing all of these diverse features (i.e., colors) even if the sensor is not perfectly accurate.
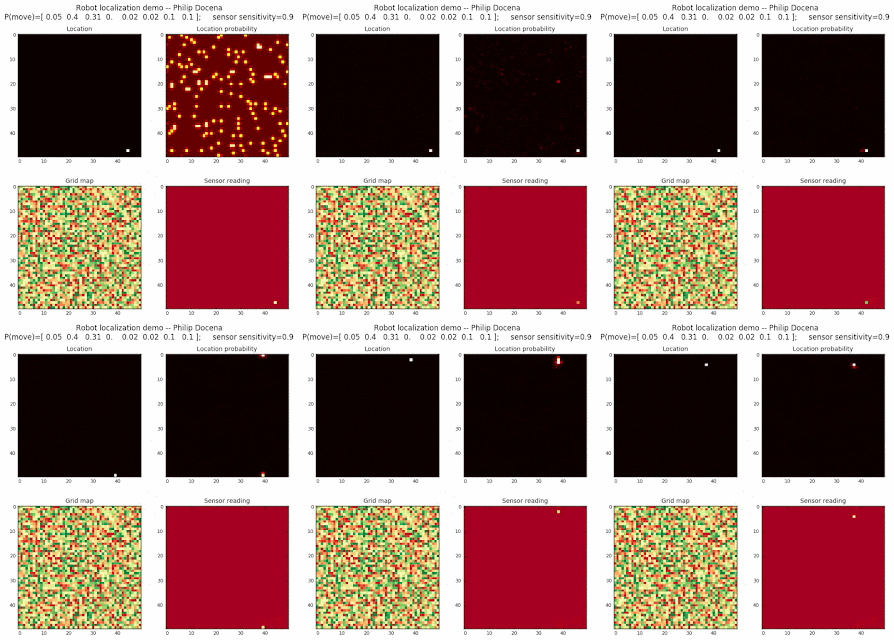
Let’s make this analysis more definitive by doing away with our visual grid color interpretation. It is often hard to tell which of two similar cells is more ‘white-hot’, so let’s use the actual probabilities. We start with another simulation, this time over a 50x50 gridmap. We will run four different levels of feature diversity (2, 4, 8, and 16 objects in the environment), but only show the two extremes. Below are the simulations:


Probability plot
It is obvious that the probability assigned to the actual cell location is higher (more white-hot) than those from other locations as more object types are added to the environment. We should be able to confirm this by plotting the predicted probabilities at the actual cell location over several iterations for each run. Here’s the graph:

As predicted, we do see that the simulation with 16 objects tends to have higher probabilities calculated for the actual cell location at each iteration.
However, we should also compare the cell probability with the maximum probability possible for each iteration. There might be cells with even higher probabilities, which would lead us to conclude that those cells are the actual location(s). Let's explore this in the next graph.
Probability vs max probability
Let’s look at the ratio of the probability of the actual grid location against the maximum probability for any cell at each step. Here’s the graph:

From the graph above, it is hard to conclude that the 16-object example has any particular advantage. It does show that the simulations with more objects tend to reach a ratio of 1.0 quickly, suggesting that the probability at the actual cell location is calculated to be at least equal to the maximum probability possible during that iteration. But we do not know how many cells have this maximum value. In other words, we might have multiple 'best' candidate locations, and the actual cell location is only one of them.
Perhaps we are not looking at the correct ratio. If we think about it, we know that the 16-object simulation is better because the number of cells that are visually comparable to the color intensity of the actual cell is minimized. This means that the probability of the predicted location will tend to be higher compared to the average over the entire grid. Similarly, the predicted cells have very high contrast relative to neighboring cells. They are also highly concentrated, with just a few candidate locations, suggesting high predictive precision. This implies that we can apply some ratio using the cells that outperform the probability assigned to the actual cell location. Let's explore these thoughts below.
Probability vs average probability
To take advantage of contrast relative to all other cells, we look at the ratio of the probability of the actual grid location against the average probability for all cells at each step (including the actual cell location). Here’s the graph:

Number of cells equal to or better than actual location probability
As the localization gets more accurate, the number of candidate cell locations tend to decrease. With fewer cells identified as possible locations, the probabilities for all cells rise as a result. We can therefore count the number of high probability location and take the inverse. The higher the value of this ratio, the better. Its maximum value is 1.0 (100%). Let’s call this current-to-best-cells ratio:

Ratio of number of best predictions against all possible cells
We could also calculate a related ratio, where we calculate the ratio between the number of high probability cell locations and the total number of grid cells in the map. As the localization become more precise, the numerator will tend to decrease, causing the ratio to decrease to 1 over the total number of cells in the map. This is the same as the above, but expressed inversely and normalized with the total map size. Let’s call this best-cells-to-total ratio:

From the two ratios, we are able to extract the best (lowest/highest) localization with the 16-object simulation. We can also observe that localization tends to be faster with more objects. This is indicated by the earlier jump of the current-to-best-cells ratio on the 16-object run, followed by the 8-object run, and so on. There is also a limit to the best localization possible with fewer object types. This makes sense because if we have only a few features types, it would be difficult to pin down an exact location.
Let's put all these graphs together for easier comparison:

Closing thoughts
It is now very clear that the more heterogeneous the environment, assuming the algorithm is able to sense the disparate objects within such environment, the faster the localization algorithm would settle on a few cells, assigning far higher probabilities than the rest of the cells. We also observed that it is also more accurate, as shown by the maximum ratio reached by a 2-object simulation vs a 16-object simulation. The implication is that the versatility of the sensor used and the variety of objects detectable by such sensor in a particular environment are key to a fast and accurate localization.
No comments:
Post a Comment